Helipad 1.3 is out now with a number of bug fixes and improvements to visualizations. Most importantly, you can mix and match time series and other visualizations, and you can display networks on spatial models now.
Network and Spatial Improvements
Most significantly, the spatial beta advances with the merging of the class formerly known as SpatialPlot into NetworkPlot, allowing the display of network connections on a patch grid. The spatial layout, which displays agent positions on the patch grid, is now available as a new network layout when a spatial model has been initialized. Other layouts can still be rotated through with the ‘l’ key to see the network structure without the patch geometry (for non-spatial models, the network visualizer will skip the spatial layout when rotating layouts). The new NetworkPlot class is fully backward-compatible with existing code for both model types.
This brings a number of benefits to both types of models, even when displaying a non-spatial network or a non-networked spatial model. First, for network models, node size can now be linked to an agent property, as had been possible in spatial models since 1.2. Network display can also be more extensively customized (e.g. labels can be toggled and customized) with the config() method previously used in the Spatial visualizer, and the config() method can now take a dict of key-value option pairs rather than calling it for every option.
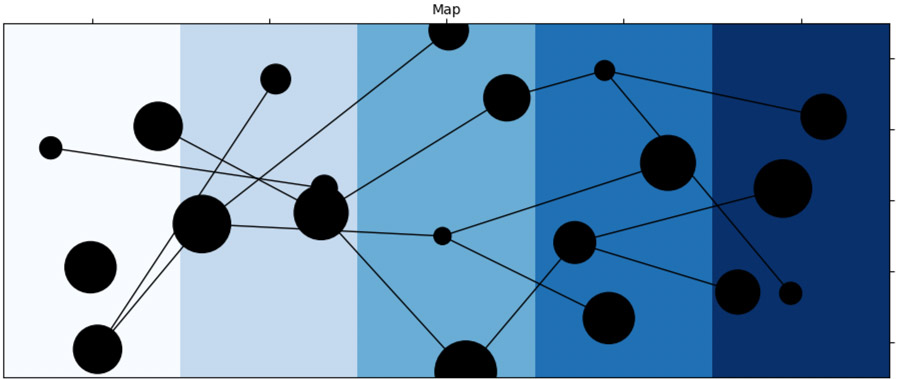
For spatial models, the aspect ratio of the patches can now be customized, as in the above example, where the aspect is set to 2. And, of course, a network can be superimposed on agents as they move along the map now.
The NetworkNodeClick and SpatialAgentClick hooks have both been deprecated and replaced by a general agentClick hook, and spatialPatchClick with patchClick for consistency.
Time Series Plots Available in the Charts Visualizer
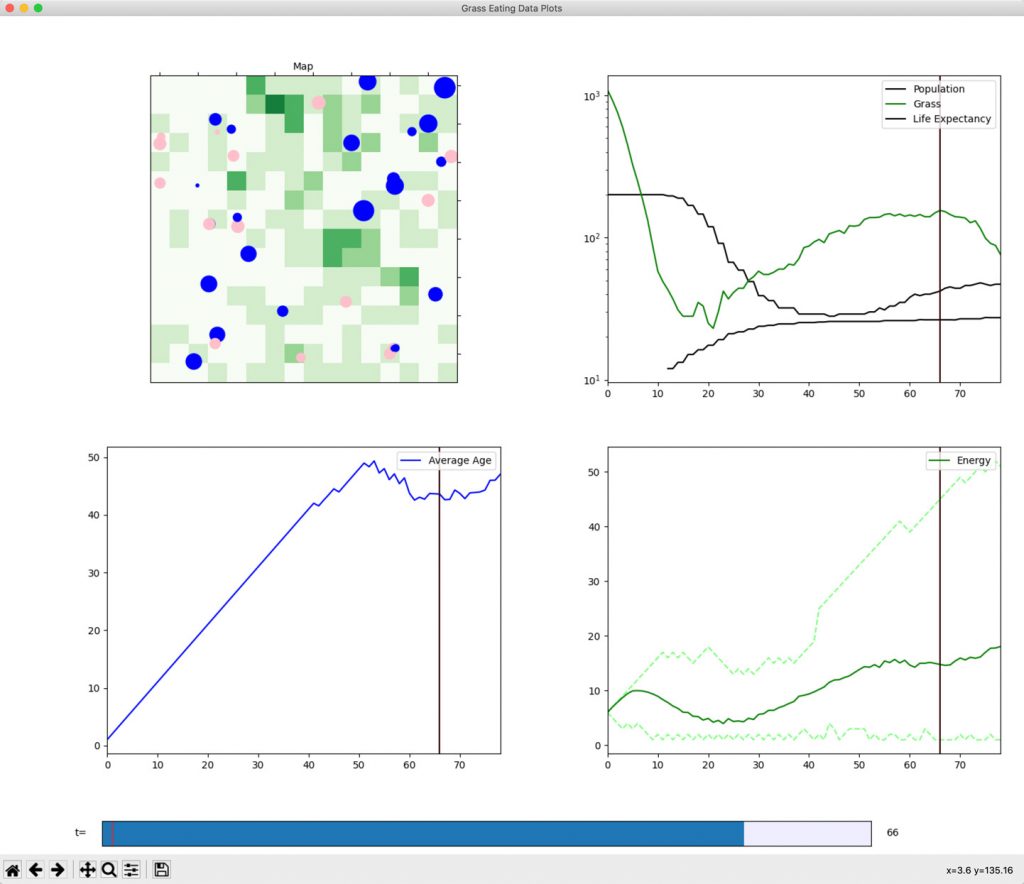
Charts visualizer.The time bar is scrubbed to t=66, which is indicated by the
vertical line in the time series plots.
When the extensible visualization API was introduced in Helipad 1.2, synchronic visualizations were handled by Charts, and diachronic visualizations with TimeSeries, despite the fact that both were able to be subdivided into plots (though slightly differently).
In Helipad 1.3, the TimeSeriesPlot class now subclasses ChartPlot, so time series can be mixed and matched with other synchronic visualizations like networks and bar charts.
Some functionality does differ from the TimeSeries visualizer to the Charts visualizer, since the former can treat time series as first-class citizens. First, TimeSeries stacks the plots, whereas Charts places them in squares. Second, the time scrubbing in Charts displays a vertical line to indicate the scrubbed time, so the entire series is always in view. Events continue to be displayed with a flash of the background, rather than vertical lines on the time series, as in the TimeSeries visualizer. Finally, automatic resolution change is not supported in the Charts visualizer.
Nevertheless, for models that require mixed visualizations, this added flexibility should open up new possibilities.
More Advanced Goods API
A new props argument on model.addGood() allows agents to hold various properties per good, making for more organized code in certain types of models. This is different from per-good parameters, which are set globally per-good, rather than per-agent per-good. For example an agent might have a reserve quantity, a minimum price, and a surplus for each good:
def maxReserve(breed): return random.randint(1,2000)
heli.addGood('sugar', '#FFFF00', props={'reserve': maxReserve, 'price': 1, 'surplus': False})
heli.addGood('water', '#00FFFF', props={'reserve': maxReserve, 'price': 1, 'surplus': False})
This gives agents 'reserve', 'price', and 'surplus' properties for each of the two goods, and sets the initial values in the same manner as the endowment argument (i.e. it can take a number, a tuple to sample from a normal distribution, or a function).
The quantity of the good held by the agent can be accessed normally with agent.stocks[good], so this new feature is fully backward-compatible with existing code. But other properties can now be accessed with a two-argument index. agent.stocks[good, 'reserve'], for example, will return the value of the agent’s 'reserve' property of the good. Agents’ good properties can be set this way too.
Other Improvements and Bug Fixes
- An
agent.transfer()method to move sub-agents in a multi-level model from oneMultiLevelobject to another. - The
Chartsvisualizer now adds a checkgrid parameter allowing its plots to be individually toggled, similarly toTimeSeries. - Improved event handling at the plot level rather than at the visualizer level. Now
ChartPlotsubclasses can handle keypresses, mouse clicks, and item pick events without having to negotiate with the entire visualizer canvas (this will be mainly useful for those creating new visualizations by subclassingChartPlot). - Patches are now created before other agent primitives in spatial models, so the
agentPositionhook can reference patches. - Fixed a visual bug in some versions of Tkinter with global checkbox parameters.
- Fixed a bug where some agents could be skipped when other agents have died that period.
- Avoided a Matplotlib bug that was introduced in 3.4.0 and fixed in 3.4.2.
API Changes in Version 1.3
- ⚠️ agentClickIntroduced to replace both
spatialAgentClickandnetworkNodeClickfollowing the merge of the spatial and network visualizers. - ⚠️ patchClickRenamed from
spatialPatchClickfollowing the merge of the spatial and network visualizers. - baseAgentAdded the
fixedstatic property. - activeMoved from
TimeSeriesPlottoChartPlotas the former now subclasses the latter; now available to allChartPlotvisualizers. - TimeSeriesPlotNow subclasses
ChartPlotfor compatibility with theChartsvisualizer. - MPLEventIntroduced.
- transferIntroduced.
- configAllow passing a
dictof key-value pairs.
Added theagentLabelandlockLayoutparameters. - AgentsPlotMerged
SpatialPlotinto the Network visualizer to allow displaying network connections on a patch grid. - addAdded the
propsargument. - GoodReplaced the
endowmentproperty with the more generalprops. The value formerly contained inendowmentcan be accessed ingood.props['quantity']. - SeriesMade the legend objects accessible with the
leglineandlegtextproperties, and added visibility controls with thevisibleproperty and thetoggle()method. - addSeriesAdded the
visibleargument. - agentTransferIntroduced.