energy good.A plot visualizer used for displaying individual agents in various layouts. Agents can be plotted in a network structure, a spatial layout (or both at once), or a scatterplot comparing agents on two data dimensions.
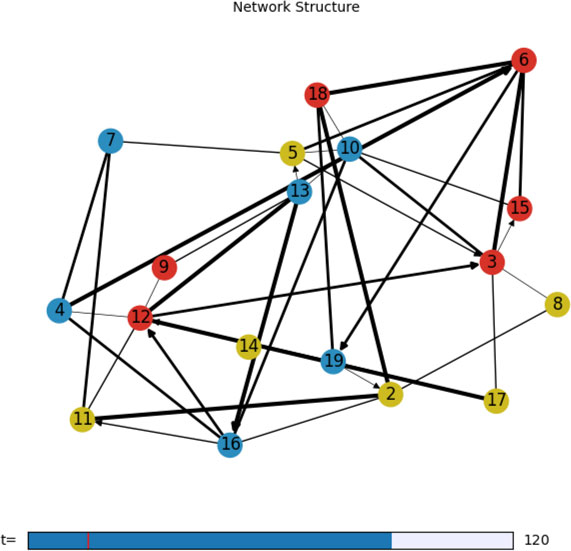
This class should not be instantiated directly. Use model.spatial() to set up a patch grid (as in the first and third images), or use Charts.addPlot(type='agents') to display networks or scatterplots (as in the second). The init arguments network and scatter can be passed to that function as kwargs. Both of these functions return the AgentsPlot object that can be interacted with afterward.
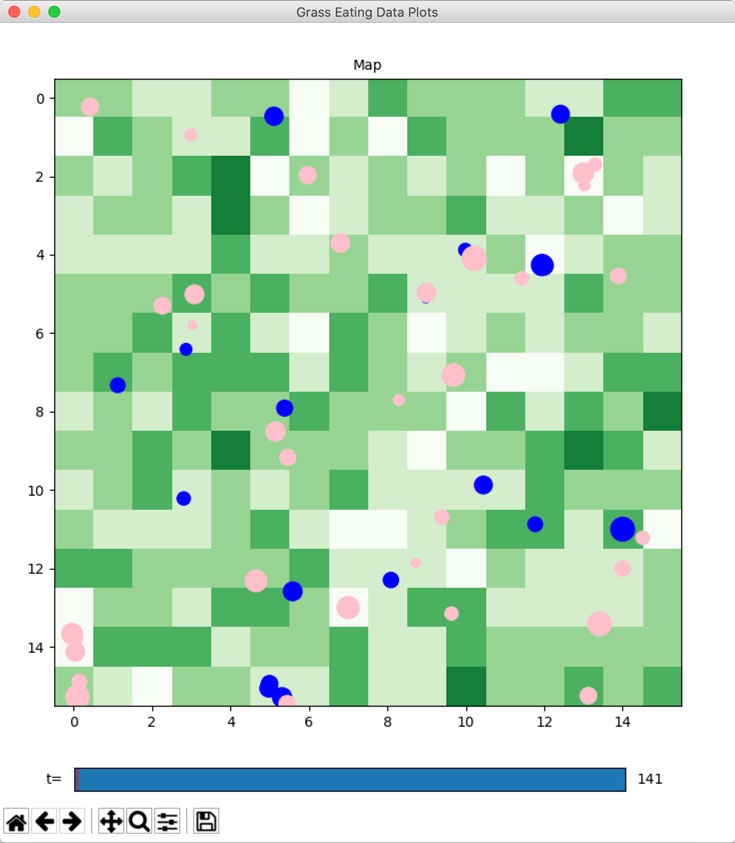
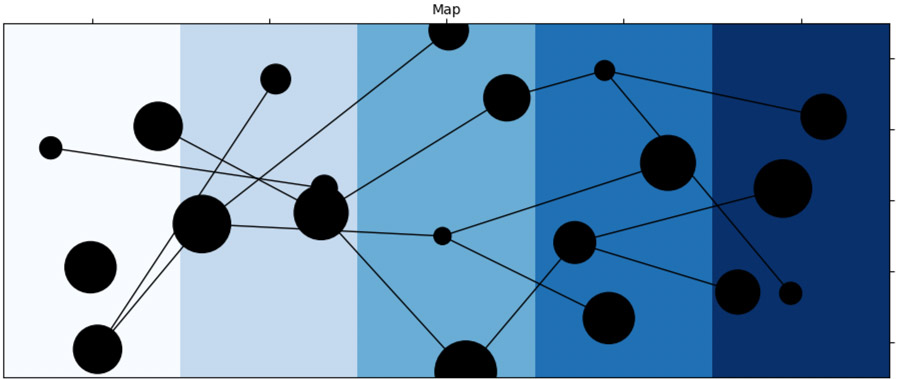
Note that rectangular patches are centered on the integer coordinates, numbering starts at 0, and agents can take fractional positions. The coordinate system for agents, therefore, runs from (-0.5, -0.5) to (x-0.5, x-0.5).
Features
- Ability to tie patch color to a property value or stocks of a good
- Ability to tie agent size to a property value or stocks of a good
- Agents can be labelled with their ID or any other property.
- Agent color reflects breed color
- Supports interactivity. Agents are clickable in any layout, and patches when visible in the
spatiallayout. Clicked agents and patches are passed to aagentClickandpatchClickhook, respectively. - The network layout can be set when registering the plot, or cycle through various layouts (including the patch grid layout, if applicable) by pressing ‘l’.
- The
'spatial'layout is available and set by default when a spatial model is registered. - The
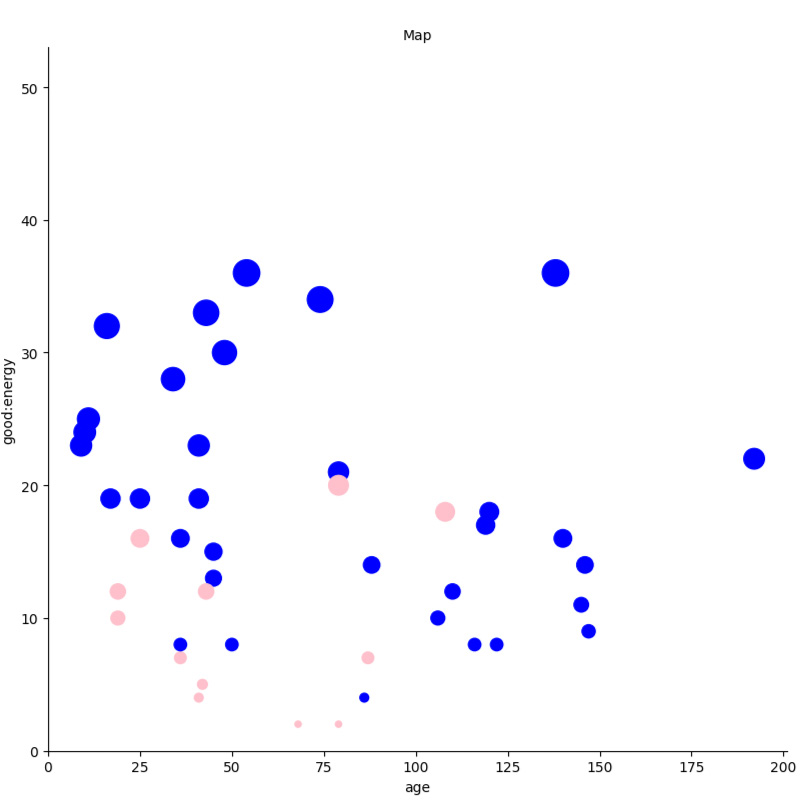
'scatter'layout is available and set by default when thescatterargument is set. - A variety of NetworkX-provided layouts are available when the
networkargument is set, the default beingspring.
- The
Initialization Parameters
prim — str, optional
Whether to limit the agent display to a particular agent primitive.
Default value: None
network — str, optional
The name of the network to display. Corresponds to the
kindargument ofAgent.addEdge(). Can be set toNoneto hide network connections on scatter and spatial layouts.Default value: 'edge'
layout — str, optional
The Networkx layout class to use on launch. Possible values are
'spatial'(which displays the agents in position on the arrangement of patches),'scatter'(which displays a scatterplot of the variables set inAgentsPlot.scatter),'spring','circular','kamada_kawai','random','shell','spectral', and'spiral'. See the NetworkX documentation for details on each of these.Default value: 'spring'
scatter — list[str,str], optional
A 2-element list with names of agent properties to plot on the horizontal and vertical axes. Agent stocks can be referenced with a value of
'good:goodname'. If set, the'scatter'layout becomes available.Default value: None
Methods
Click a method name for more detailed documentation.
active( val, updateGUI )
Turns on or off the selected state of a plot in the control panel.
config( param, val )
Sets options for the spatial plot. One argument will return the value; two arguments sets the parameter. Config options are:
patchColormap(str): The name of a Matplotlib colormap for coloring the patches. Default:'blues'patchProperty(str): The name of a property to which the colormap should correspond. For example, The default value of'mapcolor'for example means that patch color will represent the patch's value ofPatch.mapcolor, which can be set in thepatchStephook. If the string is formatted'good:goodname', patch colors will represent the patch's stocks of the good represented bygoodname. If this parameter is left unset, the patch map will remain white. Default:NonepatchAspect(num): The aspect ratio of the patches. >1 is taller, <1 is wider. Note that this doesn't affect the coordinates; only the display of the map, and only in thespatiallayout. Default:1agentMarker(str): a string representing the Matplotlib marker to be used to represent agents on the map. Default:'o'agentSize(int|str): If an integer, sets the size of the marker used to represent agents. If a string, represents an agent property or the stocks of a good to size the agent by, identically to patchProperty. Default:5agentLabel(bool|str): IfFalse, agents are drawn with no text label. IfTrue, agents are drawn labelled withagent.id. If a string, corresponds to the name of an agent property that should be used for the label. The value of a stock of goods can be used for the label by prefixing the string like'good:goodname', similar to the patchProperty parameter. Default:FalselabelSize(num),labelColor(str),labelFamily(str),labelWeight(str),labelAlpha(num),labelAlign(str), andlabelVerticalAlign(str): Various paramters to control the appearance of the labels. These parameters are passed tonetworkx.draw_network_labels()ifagentLabel != False. Default:10, 'k', 'sans-serif', 'normal', None, 'center',and'center'lockLayout(bool): IfTrue, disables rotating the network layout. Default:FalsemapBg(str): The background color of the map that shows through when patches die. Default:'black'regLine(bool|str): Whether to draw a best-fit regression line in scatterplot layout. Can takeTrueor a Matplotlib line style (e.g.'solid','dashed', etc.). Default:'dashed'regColor(str): The color of the regression line in scatterplot layout. Default:'red'regWidth(num): The width of the regression line in scatterplot layout. Default:1
draw( t, forceUpdate )
Updates the
axesobject for display on the visualizer. This function is called afterChartPlot.update()when the visualizer receives new data, and when scrubbing the time bar. Theupdate()method, therefore, should be used to store model data by time, which can then be used bydraw().Charts will refresh the entire canvas after updating each of the individual plots, so there is no need to refresh the canvas manually here unless it is desired to redraw the graph out of sync (e.g. if the subclass provides for interactivity and the plot should update while the model is paused).
Subclasses should call
super().draw(t, forceUpdate)at the end of the function.MPLEvent( event )
An event handling method that can be overridden in subclasses to catch pick (
pick_event), keypress (key_press_event), and mouse click (button_press_event) events that occur inside a particular plot. This is distinct from functions passed toMPLVisualization.addKeypress(), as those will run for keys pressed any time the visualization window is in focus, regardless of the mouse position.For example, pressing 'l' with the mouse over a
AgentsPlotwill rotate the layout. The key pressed can be accessed withevent.key.This function should not be called by user code, but it may be defined in subclasses of
ChartPlot.event.canvas.draw_idle()should be called at the end if the plot needs to be refreshed following the event. See the Matplotlib events documentation for more on interacting with theeventobject.rotateLayout( )
Rotates the layout of the plot among the several NetworkX layout classes (
'spring','circular','kamada_kawai','random','shell','spectral', and'spiral') if a network corresponding toAgentsPlot.networkexists, plus'spatial'ifmodel.patchesexists, and'scatter'ifAgentsPlot.scatterexists. This function is called when pressing 'l' with the mouse over the plot. See the NetworkX documentation for details on each of these.update( data, t )
Receives current model data and stores it for future scrubbing.
Note that this function is called when the visualizer receives new data from the model. Because
ChartPlot.draw()is called both afterChartPlot.update()and when the time bar is scrubbed, drawing code should be put inChartPlot.draw()and not here, unless there is code to be run only in the event of new data that should not be run when scrubbing (e.g. calculating new plot bounds).If the visualizer needs model properties besides the current data, the model object can be accessed with
self.viz.model.This function should not typically be called from user code, though it can be for out-of-sync plot updates when interacting with a plot. See the
agentClickhook for an example.getPatchParamValue( patch, t )
Helper function that gathers historical patch data for use in color generation.
launch( axes )
Initial code to set up
ChartPlot.axeswhenChartslaunches the visualization window. Subclasses should callsuper().launch()at the beginning of the method. This function should not be called from user code.
Object Properties
type — str
A short identifying string, to be used in the
typeargument ofCharts.addPlot().name — str
A short name, used to refer back to the plot afterward.
label — str
The title of the chart, displayed above it in the visualizer.
axes — matplotlib.AxesSubplot
The
AxesSubplotobject to be drawn to the plot area. The object is created onCharts.launch()and passed toChartPlot.launch(), where it must be stored subsequently.projection — str
The Matplotlib coordinate projection to use.
Nonedefaults to'rectilinear', but other projections available by default are'polar','3d','aitoff','hammer','lambert', and'mollweide'. Custom Matplotlib projection objects can also be passed to this argument.Initial value: None
viz — Charts
The parent
Chartsvisualizer object.selected — bool
Whether the plot is currently queued for display. Do not modify this property directly; use
ChartPlot.active()to ensure consistency with the GUI state.prim — str
Whether the agent display is limited to a particular agent primitive.
Initial value:
params — dict{str: str|num}
A dict of option values for the plot. See
AgentsPlot.config()for options.network — str
The name of the network being displayed. Corresponds to the
kindargument ofAgent.addEdge().Initial value:
ndata — dict{int: networkx.DiGraph}
A dict keyed by model time, containing historical model data.
Initial value: {}
layout — str
The current Networkx layout class being used. Possible values are
'spatial'(which displays the agents in position on the arrangement of patches),'scatter'(which displays a scatterplot of the variables set inAgentsPlot.scatter,'spring','circular','kamada_kawai','random','shell','spectral', and'spiral'. See the NetworkX documentation for details. These layouts can be rotated through in the visualizer by pressing L with the mouse over the plot, unless the'locklayout'config parameter is set toTrue. Note that'kamada_kawai'requires SciPy, and will be skipped in the layout rotation if it is not installed.scatter — list[str,str]
A 2-element list with names of agent properties to plot on the horizontal and vertical axes. Corresponds to the
'scatter'argument when the object is initialized.Initial value: None
Hooks
Click a hook name for more detailed documentation.
patchClick( patch, plot, t )
Receives the patch clicked when the
AgentsPlotplot is clicked in spatial layout.agentClick( agents, plot, t )
Runs when an agent is clicked in the
AgentsPlotplot.
charwick
Jun 12, 2021 at 17:15More complex rules for the
'agentSize'parameter, or for scatterplotting, can be used by creating properties. This example sets the size of the firms in a multi-level model to be the population of agents within that firm.charwick
Jun 16, 2023 at 18:37A single
AgentsPlotobject can support any or all of spatial, network, and scatterplot layouts, which can be rotated through with the L key. The network structure will be displayed over all layouts, including the spatial and scatterplots unless the value ofplot.networkdoes not correspond to a network name. This example makes all three layout types available.