Helipad 1.2 is a significant update that, most importantly, features a new extensible visualization API along with several new visualizations. In addition, it includes Events, performance profiling, and full Jupyterlab support.
New Visualization API
The class formerly known as Graph is now called TimeSeries. In addition, visualizations other than TimeSeries may also be used. Charts, for example, is detailed below.
Accordingly, many visualization functions have been moved out of the model object and into the TimeSeries object, in order to allow other visualization classes to implement their own functionality more flexibly. Visualizations must now be registered explicitly, and can be interacted with in a new, more object-oriented API.
heli = Helipad()

#Old way, deprecated
heli.addPlot('plotarea', 'Plot Area')
heli.addSeries('plotarea', 'reportername', 'Series Name', '#FF0000')

#New way: object-oriented and explicit
from helipad.visualization import TimeSeries
viz = heli.useVisual(TimeSeries)
plot = viz.addPlot('plotarea', 'Plot Area')
plot.addSeries('reportername', 'Series Name', #FF0000')
This allows custom visualizations to specify their own methods and functionality. The methods of the included visualizations are documented in the function reference.
There are now three ways to create custom visualizations, depending on the amount of customization needed:
- Creating a new plot type for the
Chartsvisualizer by subclassingChartPlot, which allows the plot type to be displayed in a panel alongside other visualizations (there is a tutorial notebook for creating a 3D bar chart visualization this way), - Creating an entirely new visualization window using Matplotlib by subclassing
MPLVisualization(this will maintain compatibility with both Tkinter and Jupyter), or - Creating an entirely new visualization window without Matplotlib by subclassing
BaseVisualization(it is up to the code author to maintain compatibility, or not, with Tkinter or Jupyter).
Other miscellaneous visualization improvements:
- Visualization windows no longer jump to the foreground on each refresh.
- The visualization window no longer overflows the taskbar on Windows.
New Visualizations

In addition to the existing visualizations now under the TimeSeries class, which plots model data over time, there is a new extensible Charts visualization class, which plots model data at a single point in time. Charts can take a variety of plot types, including bar charts and network diagrams (pictured above), which can be extended by subclassing ChartPlot.
The bar chart is most similar to the existing plot-series paradigm, with a bar corresponding to a series, and BarChart.addBar() analogous to TimeSeriesPlot.addSeries(). In addition, like TimeSeries can plot percentiles when registered with Data.agentReporter(), the bar chart will display reporters with percentile subplots as bars with error bars. Finally, there is a new std parameter on Data.agentReporter(), which – like the percentiles argument – creates subseries, this time depicting ± some multiple of the standard deviation of the data series.
The NetworkPlot visualizer, which requires NetworkX, comes along with a number of improvements to Helipad’s network export function. The latter now stores edge weight and direction, as well as agent breed. The visualizer displays edge weight and direction, as well as coloring nodes by agent breed color. There is also a new networkNodeClick hook that receives an agent whose node was clicked on, for additional interactivity.
In addition, Charts has a time slider at the bottom, which allows the user to revisit past model states and scrub back over the model history. Like TimeSeries, Charts can be used both in the standalone Tkinter environment, as well as in a Jupyter notebook.
Spatial API Improvements
Coming along with the new visualizers, and building on the last version’s minimal spatial pre-alpha, Helipad’s support for spatial models has taken a leap.
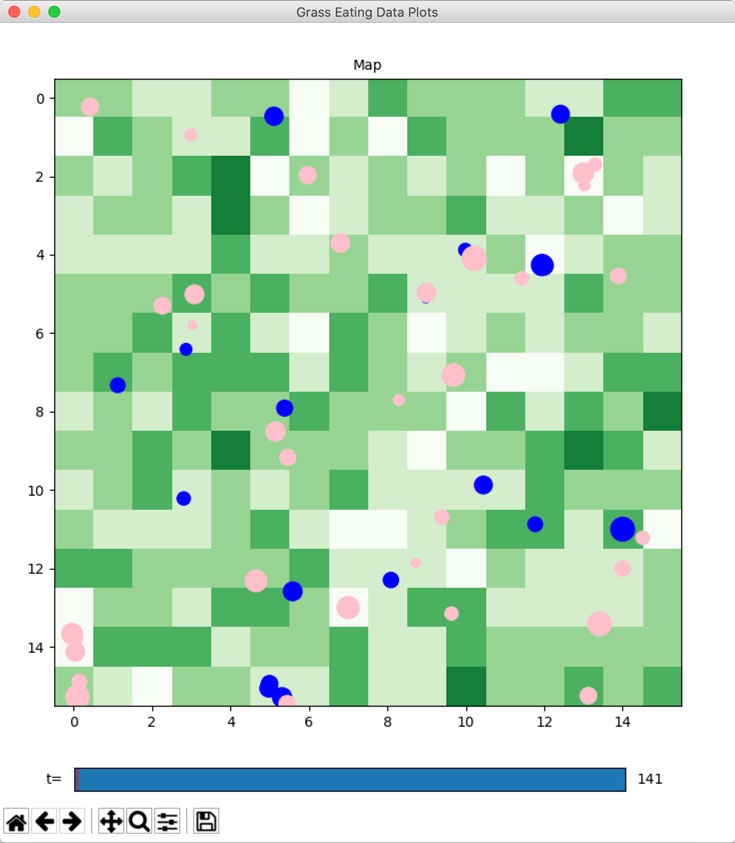
Most significantly, model.spatial() now registers and returns a spatial visualizer, a ChartPlot subclass that can be displayed alongside other panels in the Charts visualizer. Patch color and agent size can both be set to reflect a Patch property or a stock of a good. In addition, there are hooks to receive clicked-on agents and patches, allowing – like the network plot – for additional interactivity with the visualization.
Second, agents may now take float positions, meaning they are not bound to the center of their patch. There is also a variety of new angle methods and properties, including an orientation property, as well as orientTo() that sets the agent’s orientation toward another agent or patch, and forward(), which moves the agent some number of steps forward in the direction of its orientation. See model.spatial() for details.
Finally, patches may now be accessed using model.patches[x,y] in addition to the usual model.patches[x][y].
With Helipad 1.2, spatial functionality enters beta, and every effort will be made to maintain backward-compatibility as new features are added.
Events

Helipad now supports events, which are triggers that fire when a certain user-defined condition is met. Events can be registered with a new @heli.event decorator, or with model.addEvent(). They can be singular, or repeat.
When triggered, an event stores the data output at that time, and sends a signal to the visualizer, which can display it as appropriate. TimeSeries, for example, draws a vertical line on the plots (see the image to the right), and Charts will flash the background. In the image to the right there are two events, marking the increase and leveling off of population.
Events now replace the ability to set the stopafter parameter to a function, including in parameter sweeps. Instead, stopafter can now be set to the name of an event, whose associated function serves the same purpose. In addition, parameter sweeps now return not only the final model data for each registered reporter, but also the data state at the firing of each registered event.
Performance Profiling
A small feature: setting model.timer=True will print speed data to the console at each refresh of the visualizer, dividing it between model run and visualization.
Period 20 : 21.57 periods/second ( 55.71 % model, 44.29 % visuals)
Period 40 : 27.84 periods/second ( 74.21 % model, 25.79 % visuals)
Period 60 : 29.39 periods/second ( 79.79 % model, 20.21 % visuals)
Miscellaneous
- By switching the visualizers to use to the Matplotlib
widgetbackend rather thannbagg, Helipad can now be run in Jupyter Lab in addition to the classic Notebook environment. Note that using Helipad in a Jupyter notebook either way now requires ipympl, and the widgets and matplotlib extensions must be installed in order to use it in Jupyter Lab. Since the recent release of Jupyter Lab 3.0, the widget installation process is much simpler. - Because of a simplification in storing parameter values, Helipad can now be used from the command prompt without initializing a Tkinter window.
- The enabled state of the registered shocks can now be accessed and set as a pseudo-checkgrid parameter using
model.param('shocks'). - The
updateEveryparameter has been renamed torefresh.
API Changes in Version 1.2
- ⚠️ launchVisualRenamed from
launchPlots, which has been deprecated. - ⚠️ paramSweepNow returns a list of
Itemobjects rather than a tuple, in order to return more run data. - ⚠️ ReporterAdded the
collect()andclear()methods, and removed theseriesproperty, added thedataproperty, and reorganized thechildrenproperty. - ⚠️ TimeSeriesRenamed from
GraphtoTimeSeriesand now subclassesBaseVisualization. Theplotsproperty now contains all plots, and active plots are now in theactivePlotsproperty. - ⚠️ visualLaunchRenamed from
plotsLaunch, which has been deprecated. - ⚠️ visualRefreshRenamed from
graphUpdate, which has been deprecated. - agentReporterAdded the
stdargument. - ChartsIntroduced.
- BarChartIntroduced.
- AgentsPlotIntroduced.
- ChartPlotIntroduced.
- collectIntroduced.
- spatialNow returns the
NetworkPlotobject.
Agents can now take fractional coordinates.agent.moveTo()can now take a patch or an agent as a single argument.
Added angle methods and propertiesorientation,orientTo(), andforward().agent.xandagent.yare now settable. - DataAdded the
columnsproperty. - addReporterNow returns a
Reporterobject. - useVisualIntroduced.
- removePlotIntroduced in lieu of
model.removePlot(). - lightenAdded the
factorparameter. - addPlotIntroduced in lieu of
model.addPlot(). - addNow returns the new
Paramobject. - addSeriesIntroduced in lieu of
model.addSeries(). - clearIntroduced.
- removeIntroduced.
- EventIntroduced.
- addIntroduced.
- eventIntroduced.
- HelipadIntroduced the
timerproperty.
Thegraphproperty has been renamed tovisual. - removeIntroduced.
- removePrimitiveCan now take a list, and returns a boolean indicating whether or not a primitive was in fact removed.