Sets up functions, properties, and methods for spatial models. This function should be run before the control panel is drawn.
The function does several things:
- Creates a spatially fixed
patchprimitive to represent map coordinates. - Creates a network named
'space'connecting each patch to its neighbors. - Initializes the
model.patchesproperty. - Adds movement methods and properties to agents of all primitives except patches, which cannot move.
agent.moveUp(),agent.moveDown(),agent.moveLeft(), andagent.moveRight()— move the agent one patch over starting from the current location.agent.move(x, y)— moves the agent some number of patches over and some number of patches down.agent.moveTo(x, y)oragent.moveTo(patch)— moves the agent to the patch located at (x,y) or the location of the patch.agent.distanceFrom(agent)— calculates the spatial distance between the current agent and another.agent.position— the current coordinates of the agent. Patches also havepatch.position, but it cannot be modified. Integer locations correspond to the center of a patch, so the range of thexdimension is-0.5todim[0]-0.5, and mutatis mutandis fory.
agent.orientTo(agent)— Sets the agent’s orientation toward a particular patch or another agent.agent.forward(steps)— Moves the agent some distance in the direction of its current orientation.agent.patch— The patch that the agent is currently on.
- Registers the
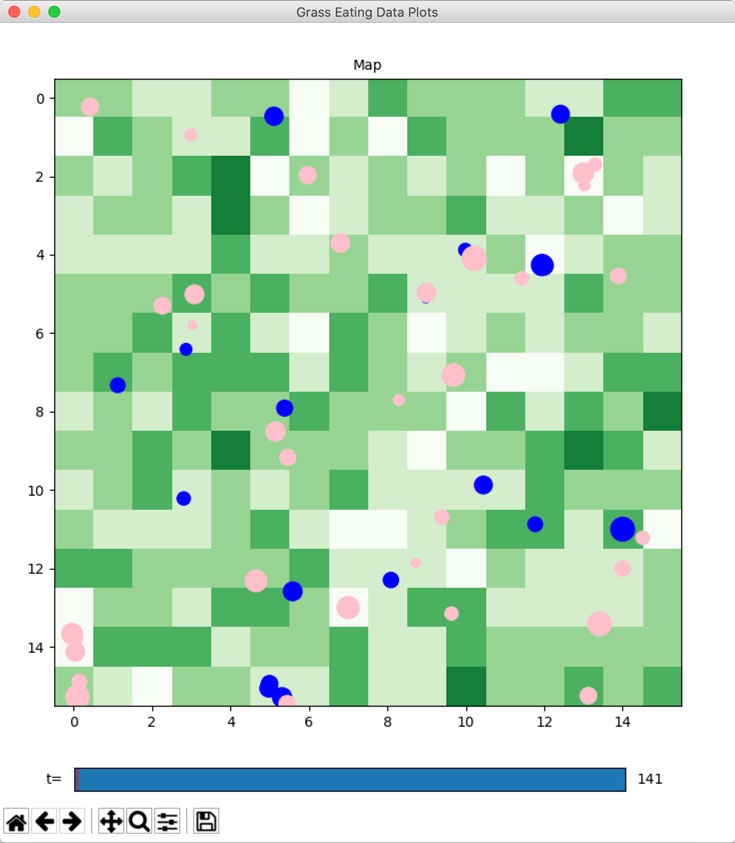
Chartsvisualizer and anetworkplot with a spatial layout upon it. The plot object has aconfig()method that allows various aspects of the map to be customized. By default patches are displayed in a grid with colors corresponding to a specified parameter, and agents are displayed as dots of their breed color. Themodel.visualobject can be used to display other chart plots alongside the spatial map. Note that functions callingmodel.spatial()do not then need to callmodel.useVisual().
By default, agents are randomly positioned on the grid on model launch. The agentPosition hook can be used to override this and specify agents’ initial positions.
Parameters
dim — int|tuple, optional
The map dimensions. Pass an integer for a square map, or a two-element tuple to specify (x,y) dimensions.
Default value: 10
wrap — bool|tuple, optional
Whether patches at the edges of the map should be connected to patches on the opposite edge, if the
geometryis tesselable.PatchesRect, for example, can support several geometries:False: Rectangular (no wrapping).True: Toroidal (wrapping on both axes).(True, False)or(False, True): Cylindrical (wrapping on one axis).
Default value: True
corners — bool|float, optional
Whether to connect patches to their corners, and if so, the weight of the connection (between 0 and 1). If
True,Patch.neighborswill return the Moore neighborhood; otherwise the Von Neumann neighborhood.Default value: False
geometry — str|class, optional
The coordinate system to be used. Currently supports
'rect','polar', and'geo'. Can also take a class specifying a custom coordinate system.Default value: 'rect'
offmap — bool, optional
Whether agents can enter areas of the map with no patch. If
Falseand an agent tries tomove()to a coordinate with no patch, the move will fail and a warning will be raised.Default value: False
Return Value — AgentsPlot
The AgentsPlot object, subclass of ChartPlot, which can be used to customize various aspects of the map visualization. See especially the options in AgentsPlot.config().
charwick
Jan 10, 2023 at 2:03As of Helipad 1.5, the grid dimensions are no longer stored as global parameters, but as properties of the patchgrid object. They are thus no longer settable in the control panel by default. A grid dimension parameter can, however, be added with a callback to update the patchgrid object: